Gorge Windbow
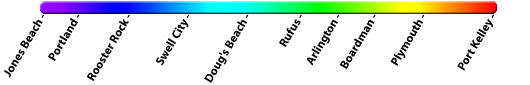
Windbow Legend
Computer forecast models generally can not resolve the topography of the Gorge and hence model predicted winds are often inaccurate. However, models can predict localized air pressure changes with a great deal of accuracy and it's these pressure differences (gradients) that drive the winds through the Gorge. The above "windbow" is a tool that our Meteorologists have developed to provide a powerful quick look of model predicted gradients.
- The cumulative height of the curve is the total pressure difference across the Gorge. The higher the curve, the stronger the wind.
- Each color of the graph is the gradient contribution between 2 locations. The thicker the color, the stronger the wind.
- Westerlies are indicated by a positive gradient (above x-axis), Easterlies indicated by a negative gradient (below x-axis).
- See our FAQ section here for additional information.
Note: This product is still in the experimental stage. Over time we will learn to correlate exact gradient values to observed winds.

|
